Focus refactoring on what matters with Hotspots Analysis
⛑️️ My First Aid Kit can help you rescue any codebase quickly and safely!
Did you ever have to deal with a codebase that felt unmaintainable?
The kind of codebase which looks like the concept of “Tech Debt” was used as a guidebook. The kind of codebase where your code quality tooling says you’ve accumulated 8 years of technical debt 💥
Maybe that’s the codebase you’re working on today. Maybe you want to do something about it, but it’s overwhelming! So what can you do?
Eat the elephant, one bite at a time
It’s the secret sauce behind recovering Legacy Code: make it a little better every week.
Legacy Code is not about good, it’s about better.
Don’t tackle all the issues at once. But do something. There’s a balance to find. I bet you can’t just stop delivering changes until you’ve cleaned the code. But you can solve little problems every time you implement a new feature or fix a bug.
Find a problem small enough to work on and ignore the other 100 problems. Rinse, repeat. After a few months, you’ll start feeling a difference.
“OK… but I’m not sure where to start!?”
Fair. Finding a problem to work on is easy: there are plenty!
But what problem will be worth solving first? Where should you start? Should you focus on the “critical” issues reported by your favorite static code analysis tool?
Static code analysis can’t help
Or at least: not alone.
A static code analysis will give you a bunch of metrics about your code quality. Notably, the code complexity. There are many ways to measure it. Cyclomatic complexity is a popular one.
The problem when you run static code analysis on a large legacy codebase is that it will report countless issues to address.
Consequently, you will try to fine-tune the settings to report fewer problems. Then, you will ignore the “regular” and “important” issues to focus on the “critical” ones. Still, you will have hundreds of them to address and that’s not helping…
When everything is urgent, nothing is!
That’s a well-known concept. When it comes to productivity techniques, we have ways to deal with it.
For example, the Eisenhower matrix helps you decide on and prioritize tasks by urgency and importance:
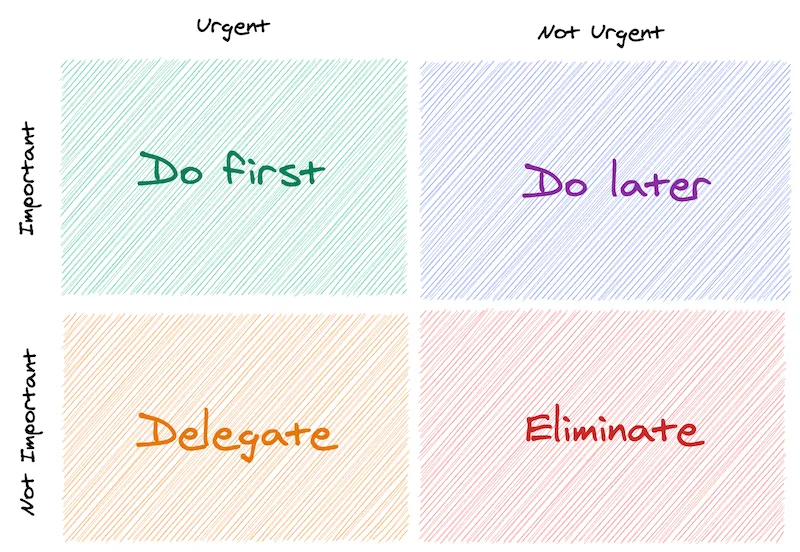
We basically need that, but for technical debt.
Churn vs. Complexity = Hotspots
Now that you know “Complexity”, let me introduce you to “Churn”.
Churn is the number of times a file has changed.
Where do you find that information? In your version control system. If you use git, then you have a mine of metadata that you can leverage!
To effectively prioritize technical debt, you need to know what is “important” AND “urgent”. That’s why you need to measure both Complexity AND Churn.
Say you get a Complexity and a Churn score for each file of your codebase. Put them in a Churn vs. Complexity graph:
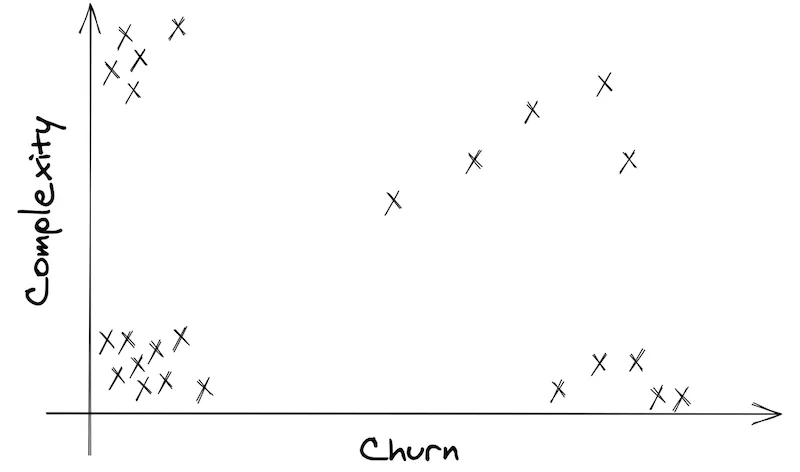
Tadaaa, here’s your prioritization matrix! Can you see the 4 quadrants?
The 4 quadrants
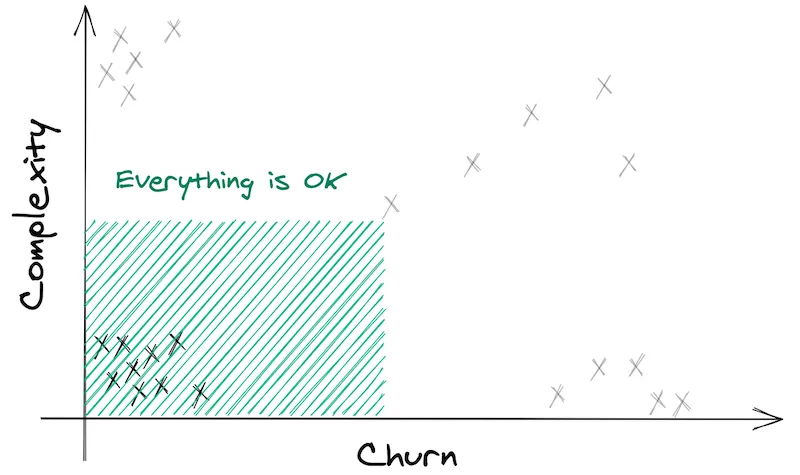
1) Simple files, barely touched
On the bottom-left are the files that are easy to maintain and not often touched. That’s a happy place.
Obviously, you don’t have to refactor these 👐
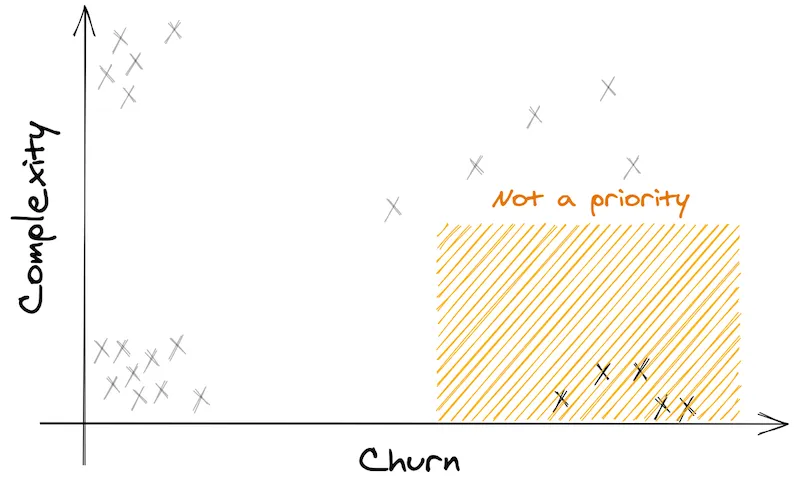
2) Complex files, not often touched
The top-left corner is interesting. These are the files that are quite complex already. Really messy.
But they don’t change often! They are stable, so to speak.
“If the code never changes, it’s not costing us money”
— Sandi Metz
Therefore, these files are not a priority.
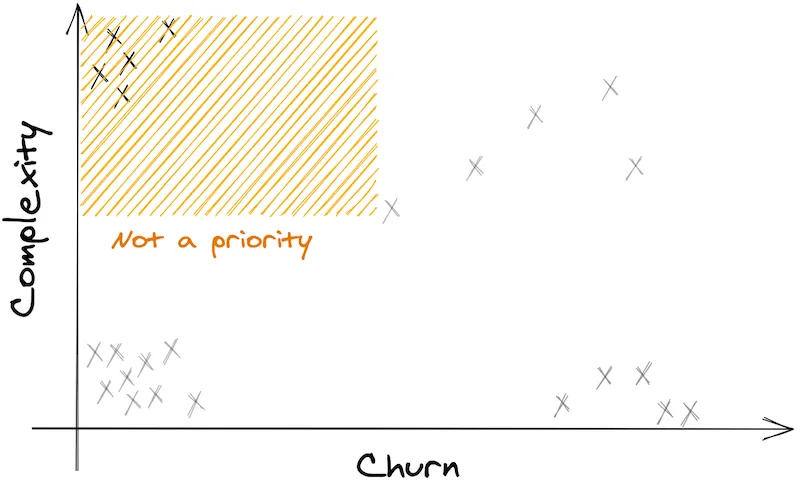
I recommend you forget about these. DON’T refactor them!
3) Simple files that frequently change
On the bottom-right, you have files that are easy to maintain.
Nothing to worry about. But it’s interesting to note that you’re changing them frequently. Maybe these are configuration files?
In any case, there’s nothing to do. Forget about them too!
4) Complex files that are constantly changing
On the top-right corner are the problematic files. The ones that hurt. They are complex. And they are frequently touched.
This is your priority!
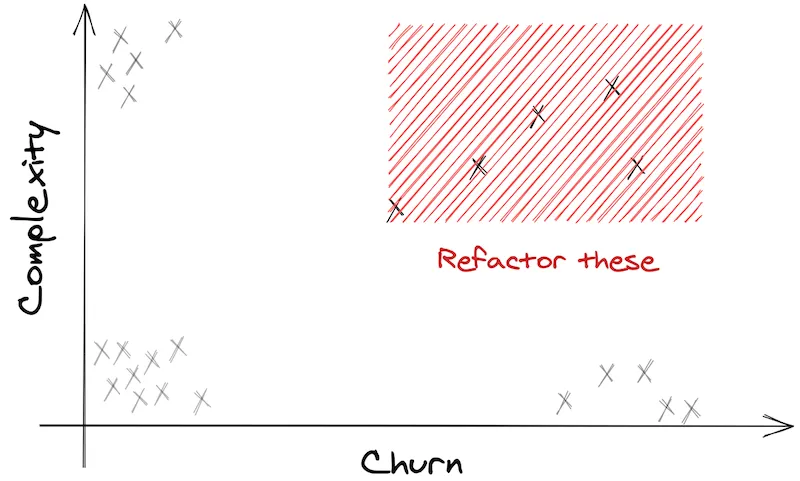
Usually, they are at the heart of your business. You’ll likely find main controllers or core classes that have become God Objects.
Focus on the top-right quadrant, forget the rest
With a Hotspots analysis, you can filter the noise and prioritize the refactoring efforts 👍
How do you generate this graph?
There are 3 things to do for a Hotspots analysis:
- Calculate the Complexity score of each file
- Calculate the Churn score of each file
- Create a Churn vs. Complexity graph with these data
Calculate the Complexity score of each file
The truth is, any complexity metric will do.
If you have a tool in your language that calculates the Cyclomatic Complexity of your codebase, use that.
If you’re using some tool like SonarQube, use that.
What you want is a score per filename. The higher the score, the more complex it is.
Pick the 50 highest scores. You’re done.
Calculate the Churn score of each file
Use your version control system. It contains all the data you need.
Also, you don’t really need to retrieve the history since the beginning of the project. Limit the analysis to the last 12 months, it’s good enough.
If you’re using git, the following command will get you what you need:
git log --format=format: --name-only --since=12.month \
 | egrep -v '^$' \
 | sort \
 | uniq -c \
 | sort -nr \
 | head -50
Copy-paste this in your project repository and you’ll get the 50 most changed files since last year!
Let’s decompose the command quickly, so you understand it:
git logis the git command to get logs data, a gold mine 💰--format=format:to remove all fancy formatting--name-onlybecause we only care about file names--since=12.monthis quite explicit
egrep -v '^$'removes all empty lines from the outputsortto sort file names alphabeticallyuniq -cto count individual file names occurrencessort -nrto sort the result in descending orderhead -50to keep the 50 most changed files only
If you need to ignore some patterns (say JSON files) you can pipe another egrep in the mix to filter them. For example:
git log --format=format: --name-only --since=12.month \
 | egrep -v '^$' \
 | egrep -v '\.json$' \
 | sort \
 | uniq -c \
 | sort -nr \
 | head -50
That’s it, you’re done.
If you’re more into SQL
Patrick DeVivo has created AskGit, a tool that can do similar queries using SQL expressions.
This is how you would get the same information with AskGit:
SELECT  file,
        COUNT(*)
FROM    stats
        JOIN commits
          ON stats.commit_id = commits.id
WHERE   commits.author_when > DATE('now', '-12 month')
        AND commits.parent_count < 2 -- ignore merge commits
        AND stats.file NOT LIKE '%.json'
GROUP   BY file
ORDER   BY COUNT(*) DESC
LIMIT   50
Create a Churn vs. Complexity graph
Pick your favorite spreadsheet software and make a graph from these 2 sets of data.
Each file name is a point that has 2 scores, which represent x and y.
If a file misses one score, you can omit it. It’s either a simple file or barely changed.
A dataviz solution like Google Visualization works fine too!
Existing tools you can use
Regarding your language, there might exist a solution that can automate that work for you.
Here are a few:
- Code Climate provides this graph, among other metrics. It’s free for open-source software.
- CodeScene does the same, with a different type of visualization. It’s also free for open-source!
- churn_vs_complexity generates the graph for Ruby codebases
- churn-php gives you the combined score to prioritize tech debt for PHP codebases
- code-complexity is a node-module that also gives you the combined score but is language agnostic
The ideal shape
A sane codebase should tend to cluster files around a line that goes from the top-left quadrant to the bottom-right one.
It never goes into the top-right quadrant.
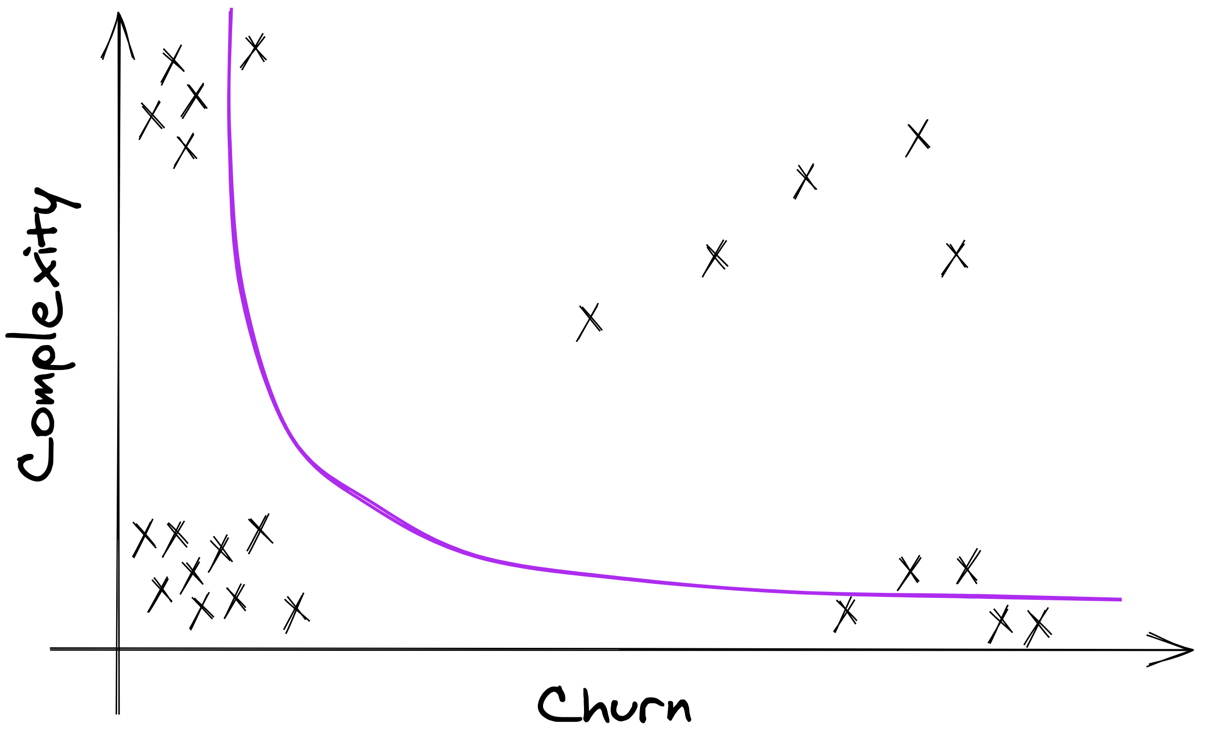
Files that are far from this line are the outliers you should focus on.
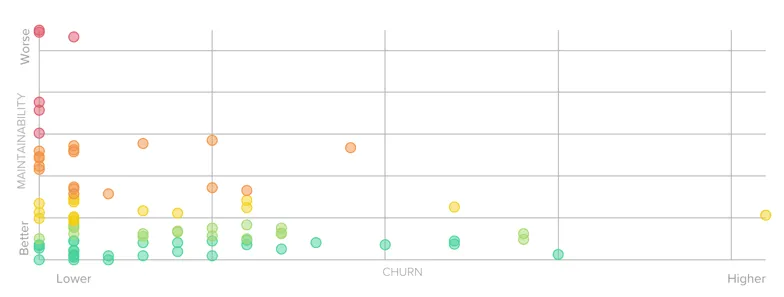
Examples in the wild
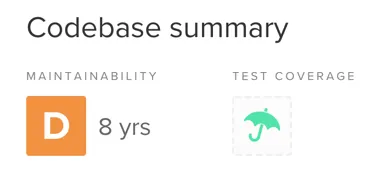
Here is an example from Code Climate of a quite maintainable codebase I used to work with:
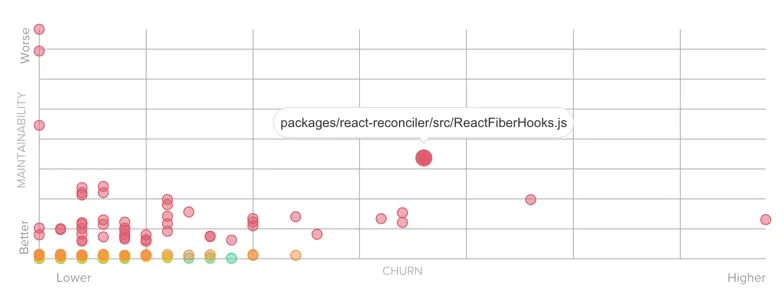
If you consider the React.js project, the static analysis will depict a depressing situation: 8 years to clean all the technical debt accumulated!
However, the Churn vs. Complexity analysis could help the team prioritize what would actually be worth refactoring:
Same observation for the Docker engine:
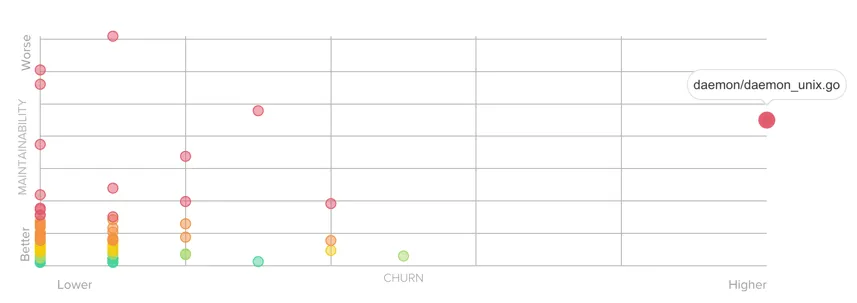
I don’t know the codebase much, but I’m convinced that refactoring daemon/daemon_unix.go is the most efficient thing to do to simplify further developments.
Do it, analyze your codebase!
Take some time to:
- Calculate the Complexity score of each file
- Calculate the Churn score of each file
- Create a Churn vs. Complexity graph with these data
Identify your Hotspots in the top-right quadrant.
Then present the results to your team and discuss. This is where the magic happens.

Written by Nicolas Carlo
who lives and works in Montreal, Canada 🍁
He founded the Software Crafters Montreal
community which cares about building maintainable softwares.
Similar articles that will help you…
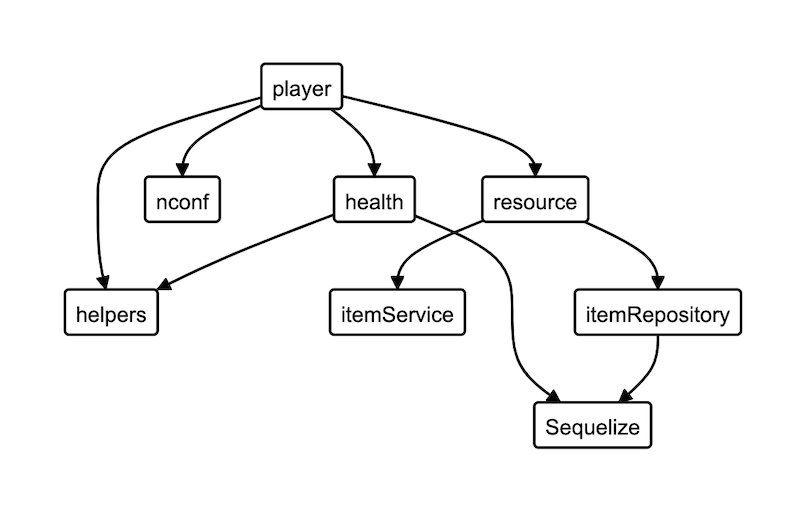
Safely restructure your codebase with Dependency Graphs
Even drawing them by hand can help you make sense of a tangled codebase! Let's see how they can help, and what tools you can use to generate these.

The key points of Beyond Legacy Code
This book is filled with practical strategies to apply on Legacy systems. Here's my summary of its salient points.

Identify who to ask for help with Knowledge Maps
Learn to draw a Knowledge Map of your codebase within minutes, and find out who owns what!
Technical Debt, Rewrites, and Refactoring
5 great talks on Legacy Code that I had the pleasure to host. Learn how to prioritize Tech Debt and rewrite systems incrementally.